The $6.2 Billion Risk-Model Failure: Inside JPMorgan’s London Whale
Verified through official records, public filings, primary post-mortems, or corroborated journalism. Zero invented facts.
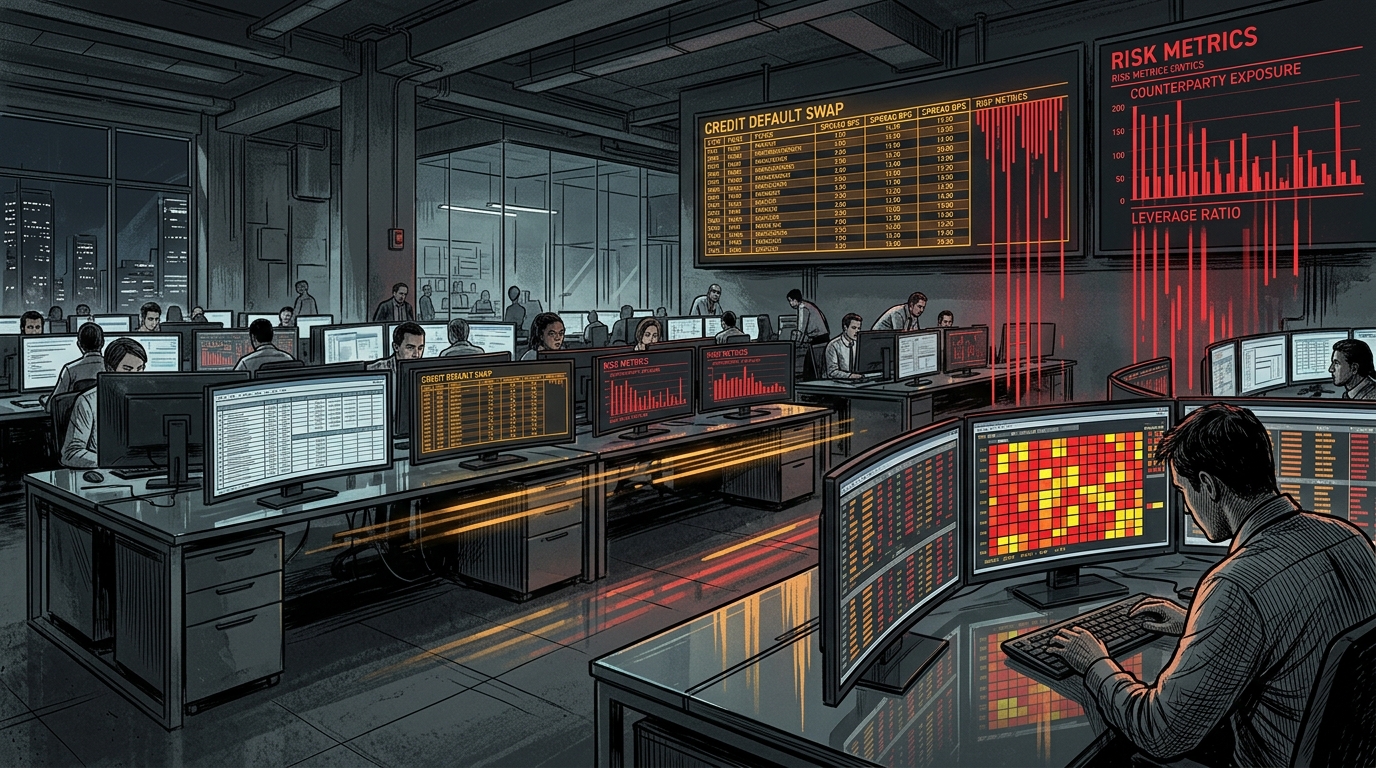
In 2012, JPMorgan Chase's Chief Investment Office suffered $6.2 billion in losses on its Synthetic Credit Portfolio amid a breakdown in risk-model governance, manual spreadsheet controls, risk limits, valuation practices, and trading oversight. A flawed new VaR methodology materially understated reported risk.
In 2012, JPMorgan Chase’s Chief Investment Office suffered $6.2 billion in trading losses on its Synthetic Credit Portfolio, one of the most consequential risk-management failures in modern financial markets. The losses did not originate from a single spreadsheet cell. They emerged from the interaction of an inadequately implemented risk model, manual spreadsheet processes, breached risk limits, concentrated credit-derivative positions, disputed valuations, and failures of management oversight.
The episode became particularly significant because the CIO introduced a new VaR methodology shortly before the portfolio’s risk was expanding rapidly. The new methodology materially reduced reported risk, while its implementation depended on manual spreadsheet calculations and data-entry processes that contained calculation and formula errors. The Senate Permanent Subcommittee on Investigations found that one identified error likely muted volatility by a factor of two and lowered VaR. (Congress.gov)
The new risk measurement therefore created a dangerous divergence between the number appearing on the risk dashboard and the economic reality of the positions being accumulated. By the end of 2012, the Synthetic Credit Portfolio had generated $6.2 billion in trading losses. The FCA independently confirmed the final loss figure in its 2013 enforcement notice. (FCA)
┌──────────────────────────────────────────────────────────────────────────────────────────┐
│                                 THE 8 NARRATIVE VOICES                                   │
├──────────────────────────┬───────────────────────────────────────────────────────────────┤
│ [PRIMARY — SENATE]       │ Directly established by the Senate report, hearing, or exhibit│
│ [PRIMARY — SEC]          │ Established by SEC enforcement order                          │
│ [PRIMARY — FCA]          │ Established by FCA Final Notice                               │
│ [PRIMARY — JPMORGAN]     │ Established by JPMorgan's internal task-force report          │
│ [INFERRED]               │ Logical consequence of documented facts                       │
│ [ANALYTICAL]             │ Systemic structural interpretation                            │
│ [ILLUSTRATIVE]           │ Mathematical example; not claimed to be actual implementation │
│ [UNKNOWN]                │ Not established in the public record                          │
└──────────────────────────┴───────────────────────────────────────────────────────────────┘
What the Evidence Does NOT Establish
To maintain strict epistemic hygiene, it is critical to explicitly bound the scope of the documented failure.
What the evidence establishes:
- The new VaR model materially reduced reported risk by about 50%.
- The new model relied on manual spreadsheet processes.
- Calculation errors affected hazard rates and correlation estimates.
- The model implementation and validation controls were inadequate.
- The portfolio expanded dramatically and risk limits were breached.
- The trading book experienced major valuation and liquidity problems, culminating in at least $6.2B in losses.
What the evidence does NOT establish:
- That one Excel cell alone caused the $6.2B loss.
- That every trading decision was made because of the formula error.
- That the exact internal cell expression was a specific
=SUM()vs=AVERAGE()syntax (this is an illustrative inference).- That the model was deliberately designed by the quantitative analyst to falsify risk.
- That counterparties deliberately “squeezed” JPMorgan as a coordinated conspiracy.
- That modern concepts such as CI/CD, immutable infrastructure, or automated regression testing literally existed as missing controls in 2012.
The Forensic Discrepancy Matrix
The following forensic matrix deconstructs the structural divergence between the digital metrics generated inside JPMorgan’s models and the physical, financial reality of global credit markets.
| Parameter | Digital Representation (Excel / “Hermes”) | Physical / Financial Reality | Evidence Status | Mechanism |
|---|---|---|---|---|
| Hazard Rate Volatility | Muted volatility by a factor of two | True credit spread volatility was expanding across Europe | [PRIMARY — SENATE] | Exact implementation mechanism not established in public exhibits |
| Reported Portfolio VaR | Dropped ~50% from $132M to $66M for the January 27 calculation | The model change did not itself reduce the underlying positions or economic exposure | [PRIMARY — SENATE] | Unvalidated spreadsheet model implementation deployed prior to completion of specified corrective actions |
| Data Ingestion & Flow | Automated risk calculations assumed seamless pipeline | Daily hazard rate inputs were manually uploaded via spreadsheet processes | [PRIMARY — SENATE] | Fragile manual data-transfer workflow vulnerable to calculation errors |
| Portfolio Liquidity | Assumed the book could be smoothly liquidated in normal trading windows | JPMorgan’s positions became sufficiently large to affect market pricing | [PRIMARY — SENATE] | Large concentrated positions reduced the desk’s ability to unwind without materially affecting market prices |
| P&L Daily Valuation | Marked at favorable internal consensus estimates | Broker quotes showed deep, widening bid-ask spreads and mounting losses | [PRIMARY — SENATE] | The desk mismarked the trading book and ignored multiple indicators of increasing risk |
Act I: The Illusion of Quantitative Mastery
[PRIMARY — SENATE] The Chief Investment Office (CIO) was established within JPMorgan Chase to manage the bank’s excess deposits. Under the leadership of Chief Investment Officer Ina Drew, the CIO managed a massive internal trading book. Within this group sat the Synthetic Credit Portfolio (SCP), managed in London by a team including Achilles Macris, Javier Martin-Artajo, and trader Bruno Iksil.
[PRIMARY — SENATE] Originally created in 2006 to hedge JPMorgan against severe corporate credit downturns, the SCP traded complex synthetic credit derivative indices—specifically the CDX (North American Investment Grade) and iTraxx (European Investment Grade) baskets—along with bespoke tranches. The Synthetic Credit Portfolio carried tens of billions of dollars in gross notional credit-derivative positions, with the broader CIO managing a much larger balance sheet.
[PRIMARY — SENATE] The model-development effort occurred amid the implementation of Basel-era market-risk and capital requirements. JPMorgan told investigators that the new models were intended to bring the CIO’s calculations into compliance with Basel III requirements, while the Senate investigation found that the resulting models also materially reduced the capital and risk measures applied to the portfolio.
The governance problem was therefore not simply that a model produced a lower number, but that a model intended to materially change the risk measurement was introduced while the underlying portfolio was simultaneously breaching risk limits.
[PRIMARY — SENATE] Patrick Hagan, a CIO senior quantitative analyst who had not previously designed a VaR model, was assigned responsibility for developing the new model. The VaR calculation relied on spreadsheet-based calculations and a manual data-upload process, with insufficient controls and frequent formula and code changes.
Act II: The Anatomy of a Calculation Error
[PRIMARY — SENATE] The new model—known internally as the “Hermes” or 95% 10-day VaR model—was designed to estimate credit hazard rate correlations and relative spread changes. The model underwent limited review and backtesting by the Model Review Group, but the Subcommittee found that implementation proceeded before specified corrective actions were completed and that the model-review process was inadequate.
[PRIMARY — SENATE] The investigation identified calculation errors involving hazard rates and correlation estimates that improperly lowered VaR. JPMorgan’s task-force report stated that one such error likely muted volatility by a factor of two.
[UNKNOWN] The exact internal cell expression responsible for the documented error is not provided in the primary public exhibits.
[ILLUSTRATIVE] Illustrative Mathematical Example A factor-of-two attenuation could mathematically arise if a quantity intended to be normalized against an average were instead normalized against the corresponding sum. This demonstrates one possible mechanism capable of producing a twofold reduction; the public investigative record does not establish that this was the actual spreadsheet formula used by JPMorgan.
$$\text{Correct Relative Change} = \frac{\Delta \text{Rate}}{\left(\frac{\text{Rate}_A + \text{Rate}_B}{2}\right)}$$
$$\text{Illustrative Error} = \frac{\Delta \text{Rate}}{\text{Rate}_A + \text{Rate}_B}$$
[PRIMARY — SENATE] In late January 2012, the CIO compared the new VaR methodology with the existing approach and prepared to apply the new methodology to the January 27 close-of-business calculation. The new methodology materially reduced reported VaR; the Senate investigation cited a roughly 50% reduction in the relevant comparison (from $132 million to approximately $66 million). The model was adopted on January 30, and formal approval followed in early February.
Act III: The Sequence of the Fracture
[PRIMARY — SENATE] The anticipated implementation of the new methodology was expected to eliminate the immediate VaR-limit problem, and the new methodology was applied to the January 27 close-of-business calculation. As reported VaR dropped, the CIO continued and increased its risky trading.
The lower reported risk measurement reduced an important constraint on additional risk-taking, masking the true exposure as the portfolio expanded.
[PRIMARY — SENATE] During the first quarter of 2012, trader Bruno Iksil executed an aggressive strategy, heavily trading the CDX.NA.IG.9 index. JPMorgan’s positions became so large that they materially affected pricing and liquidity in the relevant credit-index markets. Counterparties took positions opposing them. The desk faced valuation problems, conflicting valuations, counterparty collateral disputes, and increasing losses.
┌───────────────────────────────────────────────────────────────────────────────────────────────┐
│                           INCIDENT CHRONOLOGY TELEMETRY TABLE                                 │
├──────────────┬───────────────────────────────────────────┬────────────────────────────────────┤
│ Timestamp    │ Documented System / Market Event          │ Quantitative Metric & Impact       │
├──────────────┼───────────────────────────────────────────┼────────────────────────────────────┤
│ 2011-12      │ Basel-era capital relief mandate ongoing  │ CIO models RWA exposure reduction  │
│ 2012-01-27   │ New model calculation effective date      │ VaR computes at ~$66M (vs $132M)   │
│ 2012-01-30   │ Model adopted for VaR calculations        │ Immediate risk-limit breaches end  │
│ 2012-02-01   │ Formal model approval according to task force│ Implementation proceeds with gaps│
│ 2012-02/03   │ Trading desk increases CDX index positions│ Gross notional expands rapidly     │
│ 2012-04-06   │ Public exposure of "London Whale"         │ Financial media publishes exposés  │
│ 2012-04-13   │ CEO Dimon dismisses reports               │ "Tempest in a teapot" comment      │
│ 2012-05      │ New model revoked; legacy VaR reinstated  │ Previously understated risk exposed│
│ 2012-05-10   │ Bank announces >$2B mark-to-market loss   │ Executive restructuring begins     │
│ 2012-12      │ Total 2012 trading loss reached $6.2B     │ Investigation and unwind ongoing   │
│ 2013-03-14   │ U.S. Senate PSI publishes 307-page report │ Control failures documented        │
└──────────────┴───────────────────────────────────────────┴────────────────────────────────────┘
[PRIMARY — SENATE] The Senate report specifically found that JPMorgan ignored multiple indicators of increasing risk and mismarked the trading book.
[PRIMARY — SENATE] On April 6, 2012, the media revealed that a single London trader at JPMorgan had accumulated massive positions in the credit markets. During the April 13 earnings call, CEO Jamie Dimon famously characterized the reports as a “tempest in a teapot.”
Act IV: The Financial and Legal Reckoning
[PRIMARY — SENATE] In May 2012, the new model was abandoned and the prior risk methodology was reinstated. The previously understated risk became visible in risk reporting, and the portfolio continued to incur substantial losses during the unwind. Total 2012 trading losses reached at least $6.2 billion.
The subsequent investigations by the U.S. Senate Permanent Subcommittee on Investigations (PSI), the Securities and Exchange Commission (SEC), the Office of the Comptroller of the Currency (OCC), the Federal Reserve, and the UK Financial Conduct Authority (FCA) resulted in massive, multi-jurisdictional enforcement actions.
| Regulator | Regulatory Finding & Enforcement Action | Financial Penalty | Evidence Status |
|---|---|---|---|
| U.S. SEC | Section 13(b)(2)(A) & (B) of Exchange Act — Deficient internal controls and false books and records | $200,000,000 | [PRIMARY — SEC] |
| OCC | 12 U.S.C. § 1818(b) — Unsafe and unsound practices in model risk governance and derivative oversight | $300,000,000 | [PRIMARY — SEC] |
| Federal Reserve | Cease-and-Desist Order — Inadequate board oversight of risk management and capital modeling | $200,000,000 | [PRIMARY — SEC] |
| UK FCA | Principle 2 & Principle 3 — Failure to conduct business with due skill, care, and diligence | £137,610,000 | [PRIMARY — FCA] |
Trading Impact: [PRIMARY — FCA] Mark-to-market liquidation and counterparty closeout losses across the Synthetic Credit Portfolio throughout 2012 totaled $6.2 billion.
[PRIMARY — SENATE] The Senate PSI report concluded that the model operated through spreadsheets and manual uploads without sufficient quality control. The Senate investigation found that the model’s deficiencies contributed to inaccurate risk reporting, while the SEC separately found deficient internal controls and books-and-records violations.
Systems Prevention Playbook
The collapse of the London Whale portfolio demonstrates the extreme danger of model-risk failures embedded within broader governance breakdowns. To prevent quantitative models from diverging from physical and financial reality, engineering and risk organizations must implement concrete defenses across the 3 Engineering Defense Classes:
1. Boundary Constraints (Model Compilation & Schema Collars)
- Modern engineering control derived from the incident: Prohibit the use of uncompiled, client-side spreadsheet workbooks for calculations that directly determine capital allocation or regulatory compliance.
- Version-Controlled Model Artifacts: Every mathematical model that computes risk must exist as a compiled, version-controlled software artifact with invariant assertions and immutable audit logging.
- [ENGINEERING RECOMMENDATION] Mathematical Invariant Assertions: Implement automated boundary asserts that trigger hard build failures if key statistical properties are violated.
2. Friction Defenses (Independent Dual-Model Auditing)
- Shadow Parallel Runs: When replacing a mission-critical risk engine, the new model must run in “shadow mode” in parallel with the legacy engine.
- [ENGINEERING RECOMMENDATION] Distribution Comparison:
MODEL CHANGE ↓ Parallel execution ↓ Distribution comparison ↓ Materiality threshold ↓ Independent review. Ifabs(new_var - legacy_var) / legacy_var > approved_threshold, automatically block production deployment until independently audited by a third-party review team. - Automated Data Pipelines: Eliminate manual upload processes. Raw market inputs must be ingested through immutable, authenticated APIs with schema validation.
3. Emergency Brakes (Market Concentration Tripwires)
- Physical Market-Share Collars: Software must enforce risk tripwires based on external physical reality, not internal digital assumptions.
- [ENGINEERING RECOMMENDATION] Position-Concentration Collar: Define a pre-approved concentration threshold based on instrument liquidity, market depth, regulatory requirements, and unwind capacity. Crossing the threshold blocks further position expansion until independent review.
The Archivist’s Verdict
The Archivist’s Assessment:
The London Whale was not a $6.2 billion spreadsheet mistake. It was a model-risk failure embedded inside a much larger governance breakdown.JPMorgan’s CIO replaced its existing VaR methodology with a new model whose implementation relied on manual spreadsheet processes and insufficient controls. The critical engineering failure was therefore not merely an incorrect spreadsheet formula. It was the absence of independent controls capable of determining whether a dramatic, 50% change in a digital risk measurement corresponded to a real reduction in financial exposure.
When an organization allows unvetted software abstractions and manual calculations to override empirical market realities, it stops managing risk and begins manufacturing its own blindspots. The catastrophe was produced not by one bad cell alone, but by the devastating interaction between a materially changing risk model, weak implementation controls, concentrated trading positions, and a failure to heed the physical limits of market liquidity.
Primary Sources & Official Filings
- U.S. Senate Permanent Subcommittee on Investigations (PSI) — JPMorgan Chase Whale Trades Final Report (307 Pages)
- U.S. Securities and Exchange Commission — Administrative Proceeding File No. 3-15507 / Release No. 34-70458
- JPMorgan Chase & Co. — Report of the Management Task Force Regarding 2012 CIO Losses
- Office of the Comptroller of the Currency (OCC) — Consent Order AA-EC-13-04
- UK Financial Conduct Authority (FCA) — Final Notice to JPMorgan Chase Bank, N.A.
What Was JPMorgan’s Chief Investment Office?
JPMorgan Chase’s Chief Investment Office (CIO) was an internal division responsible for managing the bank’s excess deposits and overall investment portfolio, including hedging strategies to protect against macroeconomic tail-risk events. Operating from London, the CIO’s Synthetic Credit Portfolio held credit-default swap positions with gross notional exposure in the tens of billions of dollars. According to the Senate PSI report, JPMorgan treated the CIO’s activities as a low-profile internal treasury function rather than a trading desk requiring rigorous oversight — an assumption that proved catastrophically wrong when the portfolio’s risk exposure expanded and its VaR model failed to surface the true scale of the positions.
Then vs Now: Engineering Evolution After the London Whale
| 2012 Failure Pattern | Modern Defensive Standard |
|---|---|
| Risk model implemented in manually maintained Excel spreadsheets | Enterprise risk models must be implemented in validated, version-controlled code repositories with independent model validation team sign-off |
| VaR calculation error undetected during model transition review | Parallel running: any new risk model must operate in parallel with the legacy model for a minimum observation period, with discrepancies above threshold triggering escalation |
| Risk limits breached without executive escalation | Hard automated risk limits with mandatory kill-switch: gross notional and VaR breach triggers automatic position freeze requiring CRO authorization to override |
| Regulatory reporting reflected flawed model outputs | Model inventory and validation attestation filed with regulators; any model change requires 30-day advance notice |
| Senate PSI found CIO misled the OCC on position scale | Enhanced supervisory expectations (post-2012 SR 11-7 guidance) requiring model risk management frameworks at all large banks |
FAQ: JPMorgan London Whale Explained
What caused JPMorgan’s $6.2 billion London Whale loss?
A formula error in a manually maintained Excel VaR model understated risk by approximately half. This masked the true exposure of the Synthetic Credit Portfolio as positions expanded, risk limits were breached, and counterparties traded against the concentrated credit-default-swap positions.
What was the London Whale trade?
Trader Bruno Iksil accumulated credit-default-swap positions large enough to visibly move CDS index markets. The positions were designed as macro hedges but grew to tens of billions in gross notional exposure as the understated VaR obscured the true risk from management oversight.
What was wrong with the Excel VaR model?
The Senate PSI found that a hazard rate volatility formula error muted reported volatility by approximately a factor of two, materially lowering the reported VaR. The error existed in a manually maintained spreadsheet not subject to the same validation controls as the enterprise risk engine it replaced.
What regulatory fines did JPMorgan pay?
Over $920 million combined: $200M to the SEC, $300M to the OCC, $220M to the Federal Reserve, and £137.6M to the UK FCA. The Senate PSI concluded CIO management had misled regulators about the positions.
What is Value at Risk (VaR)?
A statistical measure of the maximum expected loss over a given time period at a specified confidence level. Banks use VaR to set risk limits and report market exposure to regulators. Understated VaR makes actual risk invisible to oversight mechanisms.
Why does it matter that an Excel spreadsheet was used?
Enterprise risk models must be implemented in validated, version-controlled code with independent validation team attestation. Manual spreadsheets cannot enforce formula integrity, version control, or peer validation — the exact failure mode that allowed the calculation error to persist undetected through a live model transition.
The Evidence Ledger & Source Audit
ErrorLedger Epistemic Standard & Public ReceiptsU.S. Senate Permanent Subcommittee on Investigations (PSI), U.S. SEC & OCC Enforcement Actions